Polynomial Method#
Theory#
Polynomial method for lower bound of query complexity $\( poly() \)$
Plot#
import numpy as np
# import plot_config
import matplotlib as mpl
# mpl.rcParams['figure.dpi'] = 200
import matplotlib.pyplot as plt
# %matplotlib inline
%config InlineBackend.figure_format = 'retina'
fig, ax = plt.subplots(figsize=(6, 4))
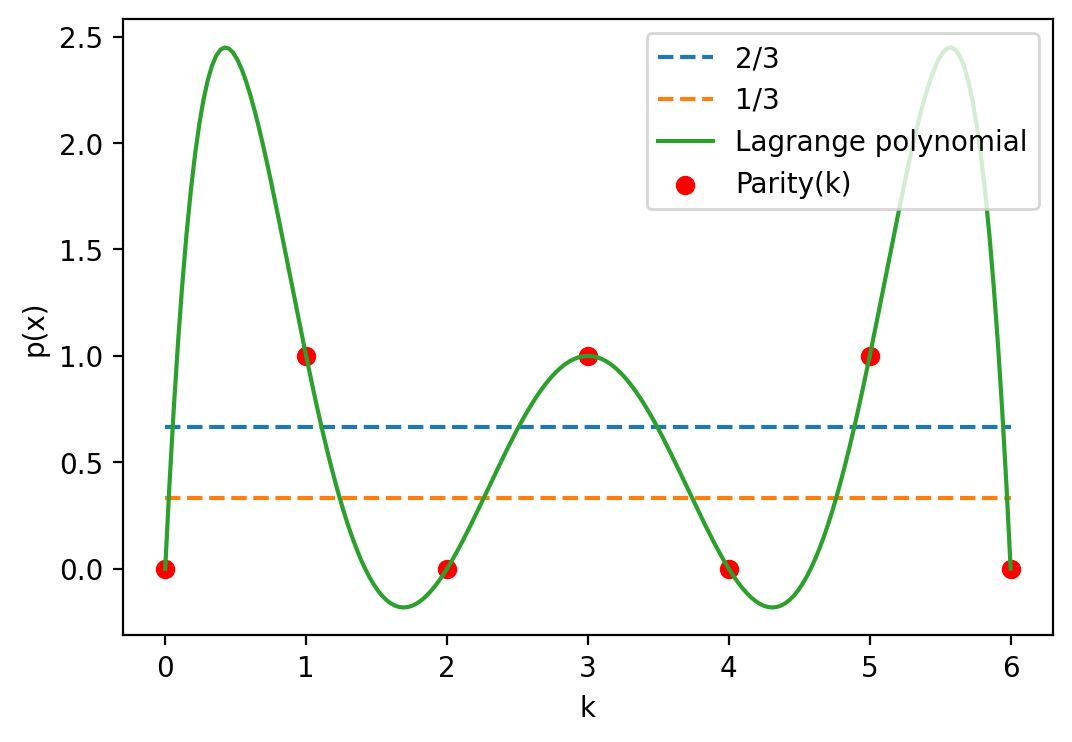
dx = np.array([0,1,2,3,4,5,6])
y =[0,1,0,1,0,1,0]
# Lagrange polynomials
x = np.linspace(0,6,200)
p = x*(x-2)*(x-3)*(x-4)*(x-5)*(x-6)/(-1*1*2*3*4*5) - x*(x-1)*(x-2)*(x-4)*(x-5)*(x-6)/(3*2*1*1*2*3) - x*(x-1)*(x-2)*(x-3)*(x-4)*(x-6)/(5*4*3*2*1*1)
x1 = np.linspace(0,6,50)
y1= [2/3]*50
x2 = np.linspace(0,6,50)
y2= [1/3]*50
ax.plot(x1, y1, '--')
ax.plot(x2, y2, '--')
ax.plot(x, p)
ax.set_xlabel('k')
ax.set_ylabel('p(x)')
# ax.set_xlim(-1, 10)
# ax.set_ylim(0, 11)
ax.scatter(dx, y, c='r', marker='o')
ax.legend(('2/3', '1/3', 'Lagrange polynomial', 'Parity(k)'), loc='upper right')
plt.show()
# plt.savefig('polynomial_method.pdf',transparent=True, dpi=300)